SAPのアーキテクチャを説明するために、ダイアグラム図を作成することがあると思います。その際にベンダー純正のアイコンを使うとカッコよくなりますので、画像(SVG)の入手方法とダイアグラム図の簡単な作成方法を説明します。
SAP ダイアグラム図用のアイコン入手方法
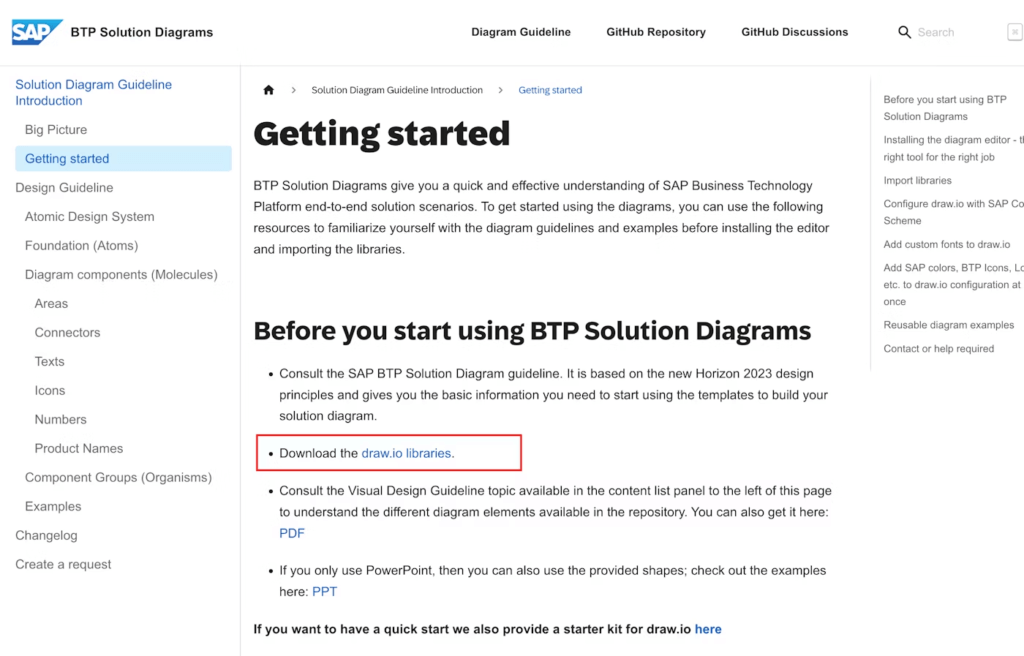
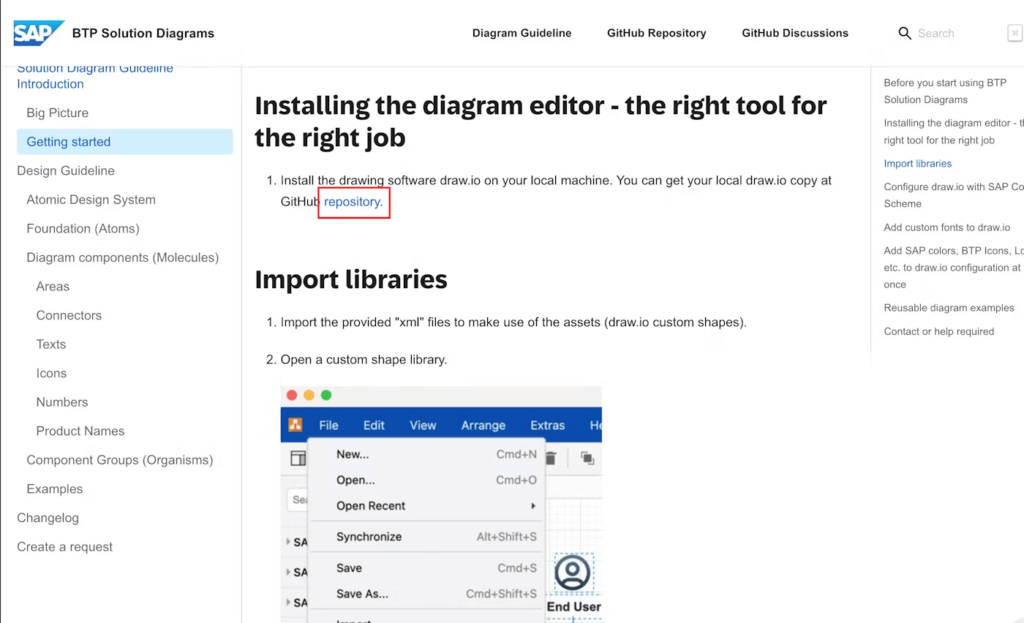
SAP ダイアグラム図用のアイコンは、SAP公式のGithubサイトから入手できます。
https://sap.github.io/btp-solution-diagrams

最初にガイドラインを読んでください。
https://qiita.com/embed-contents/link-card#qiita-embed-content__a3b1fc75ca74d38bcaabc4567fe604c4

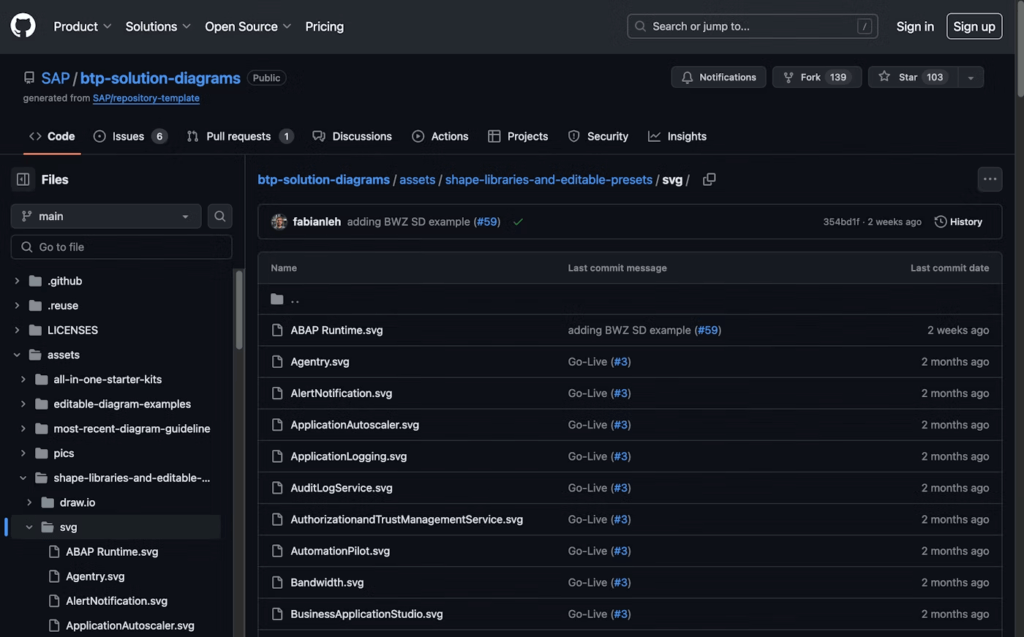
アイコンのダウンロード先リンクはこちらになります。
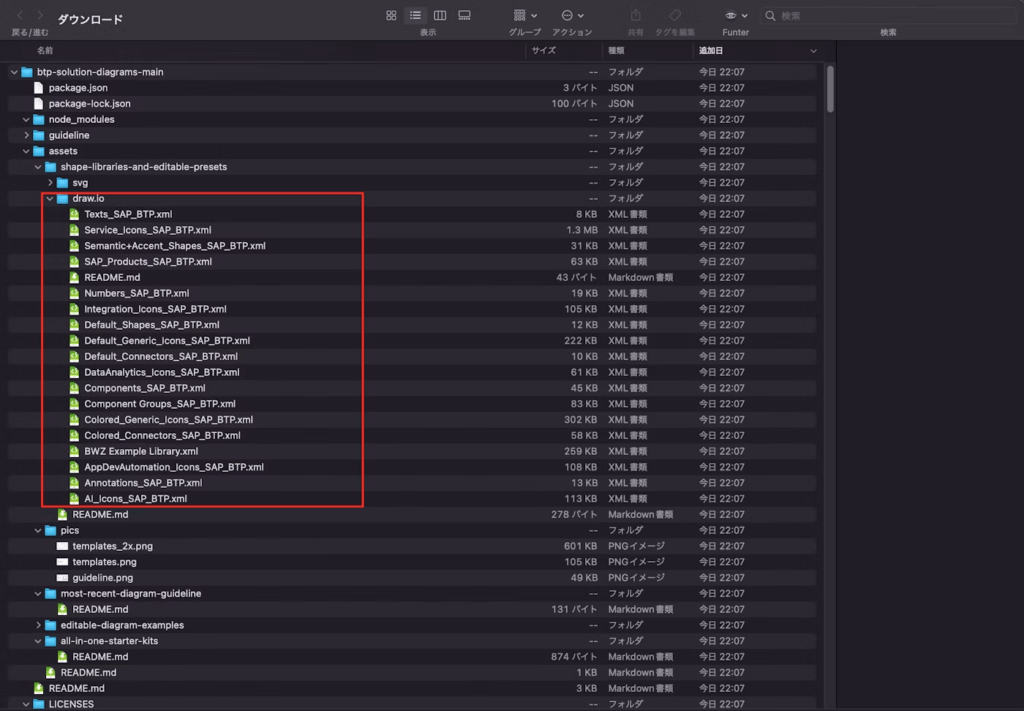
https://github.com/SAP/btp-solution-diagrams/tree/main/assets/shape-libraries-and-editable-presets/draw.io
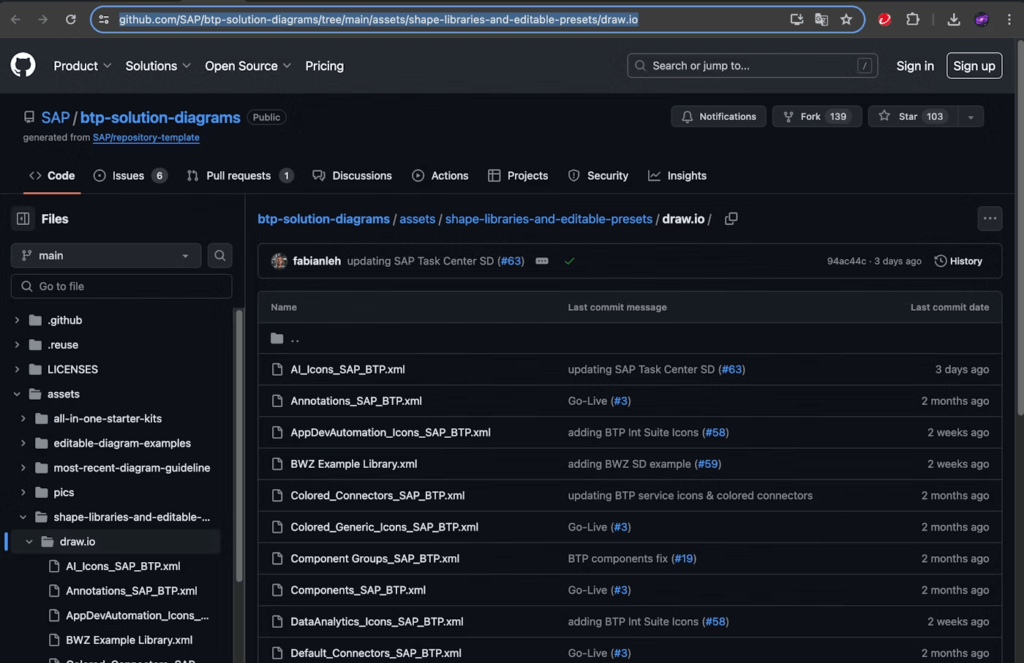
各アイコン群を開いて一つ一つダウンロードする方法もありますが、
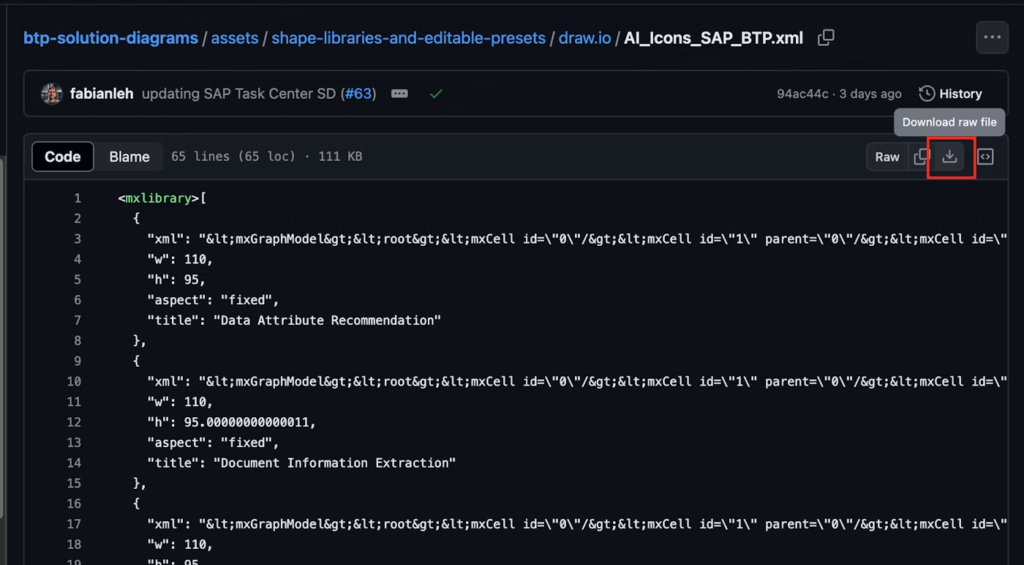
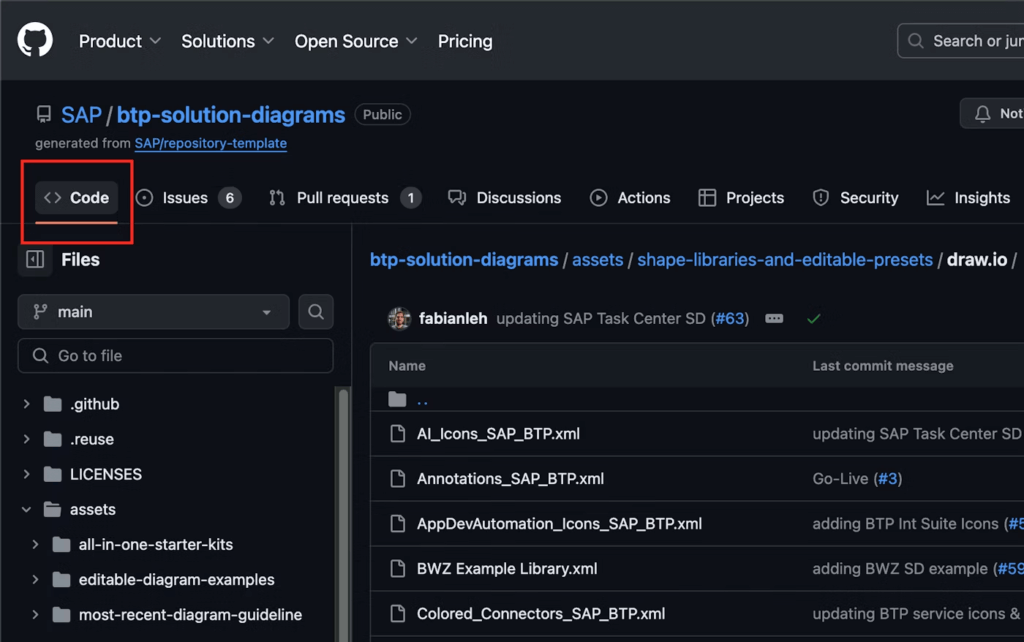
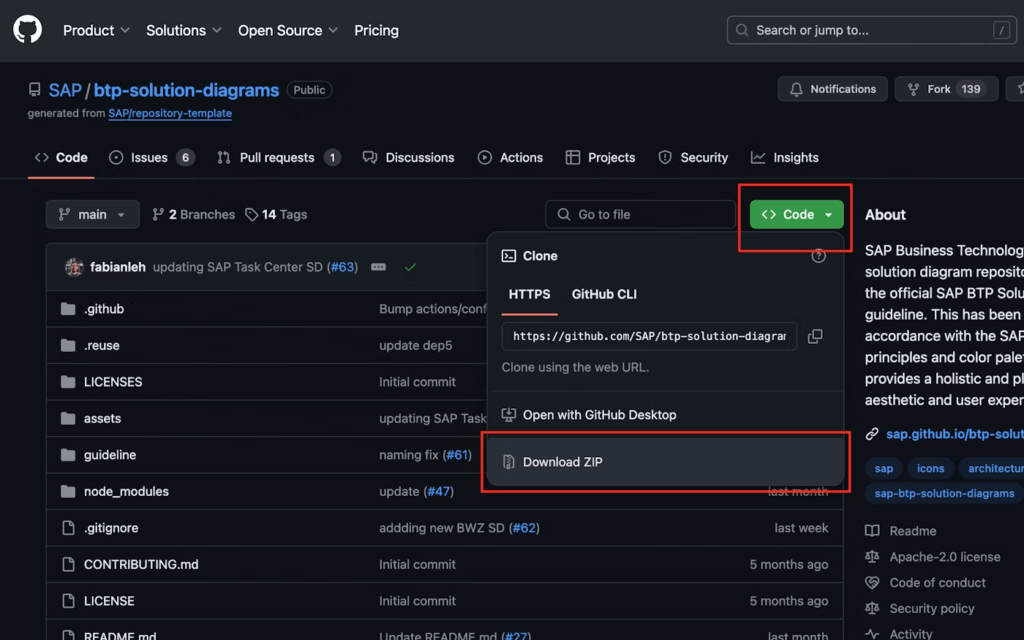
面倒なので、<>Code -> <>Code -> Download ZIP の順にクリックして、一括ダウンロードしてしまった方が楽そうです。
ダイアグラムエディター drawio
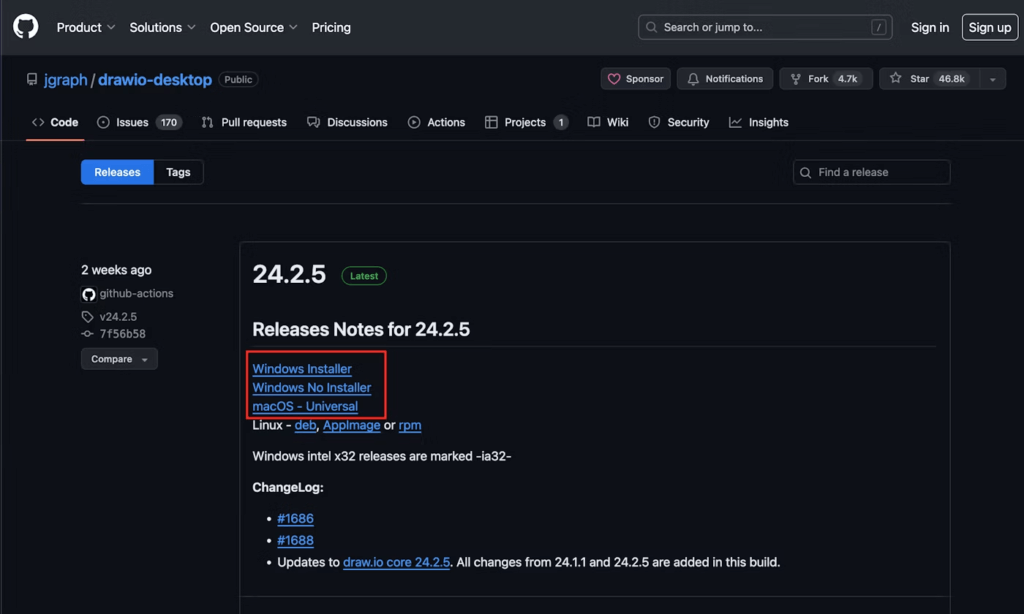
ダウンロードできるのはアイコンだけでなく、ダイアグラムエディターのdrawioも入手することができます。Visioを用意する必要がないのは嬉しいですね。
drawioをインストールして起動後、ファイル -> ライブラリを開く の順に開きます。
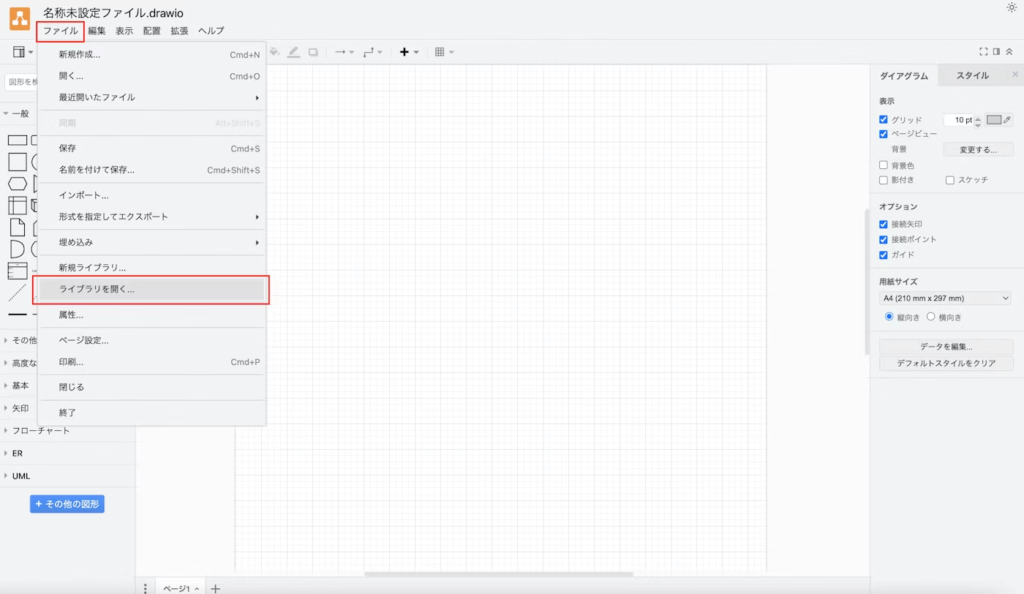
ダウンロードした任意のアイコン群を開きます。
https://github.com/SAP/btp-solution-diagrams/tree/main/assets/shape-libraries-and-editable-presets/draw.io
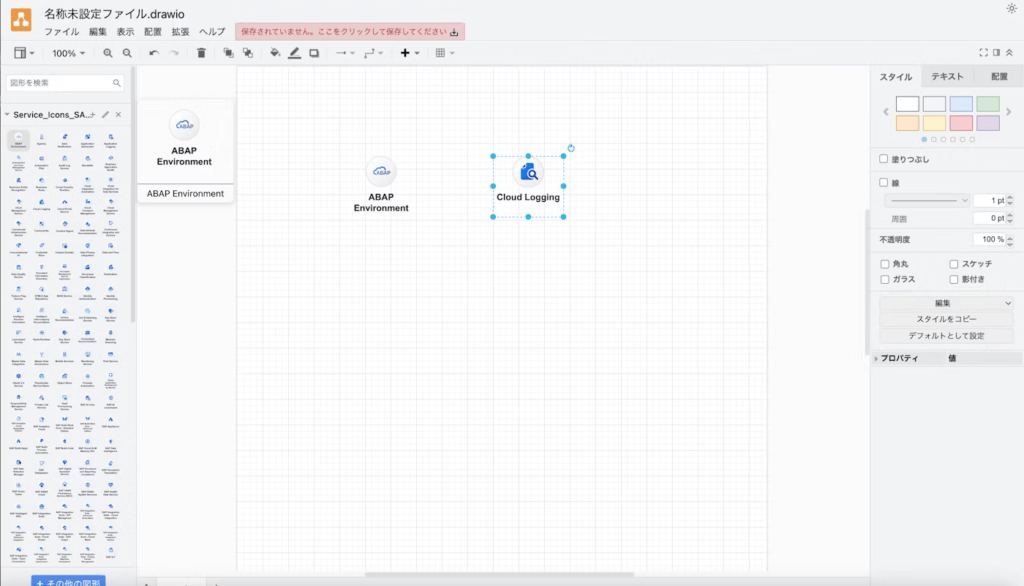
SAPのアイコンを選択できるようになりました。あとはドラッグ&ドロップするだけです。
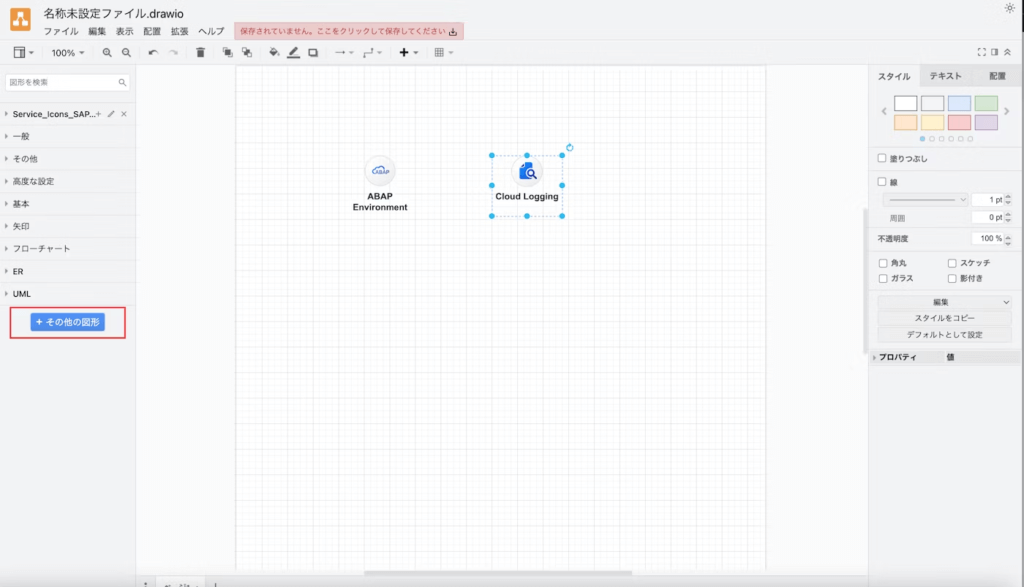
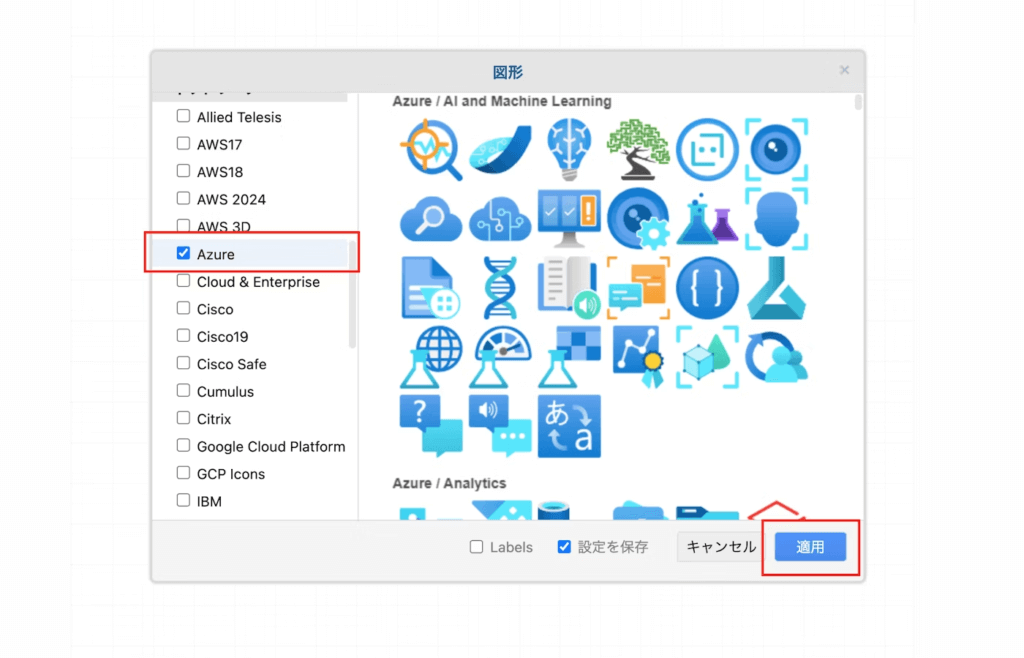
drawioはAzure、AWS、GCPなどのアイコンが最初から用意されています。「+その他の図形」をクリックし、
任意のアイコン群にチェックを入れて「適用」ボタンをクリックします。
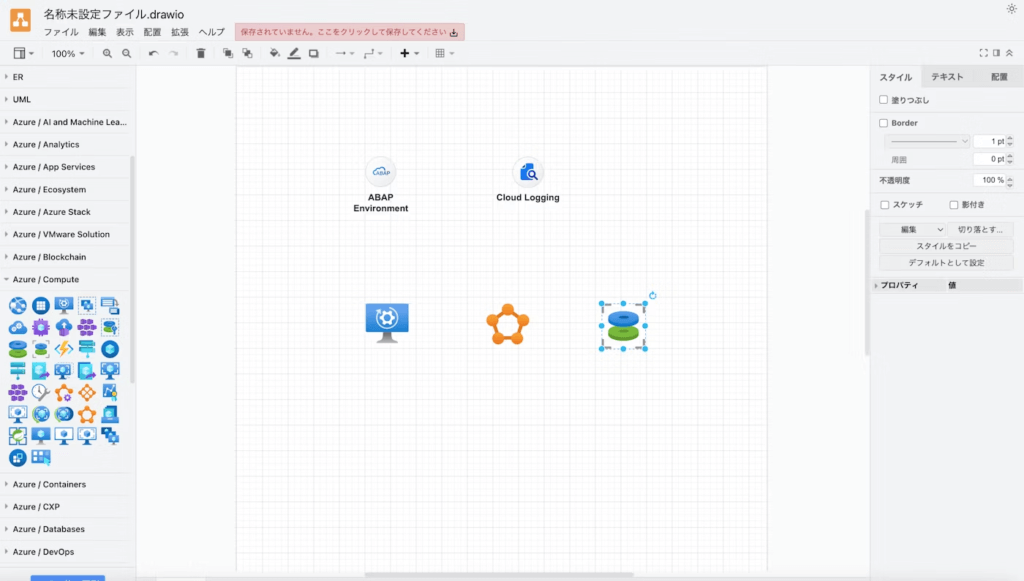
Azureのアイコンを利用できるようになりました。
PowerPointでの利用
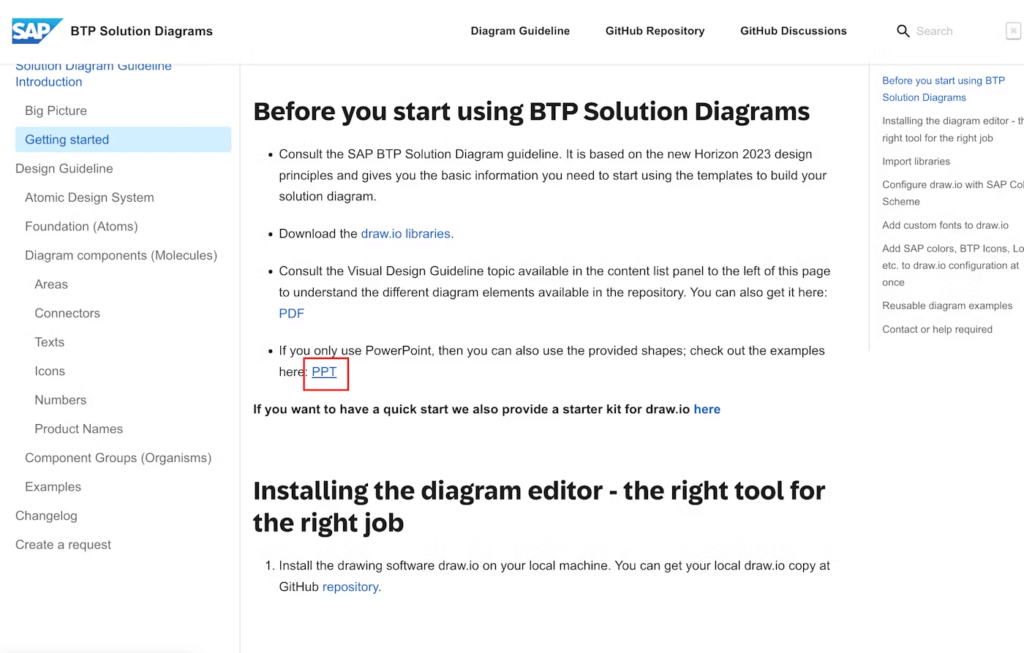
ダイアグラムエディターではなくPowerPointでアイコンを利用したい場合もあると思います。SVGファイルも個別に用意されているので、PowerPointの画像を挿入で読み込むこともできますが面倒です。
PowerPointで利用するなら、こちらのリンクをクリックして、全てのSAPのアイコンが用意されたPowerPointのテンプレートをダウンロードしましょう。
https://d.dam.sap.com/a/e7KMGSu?rc=10
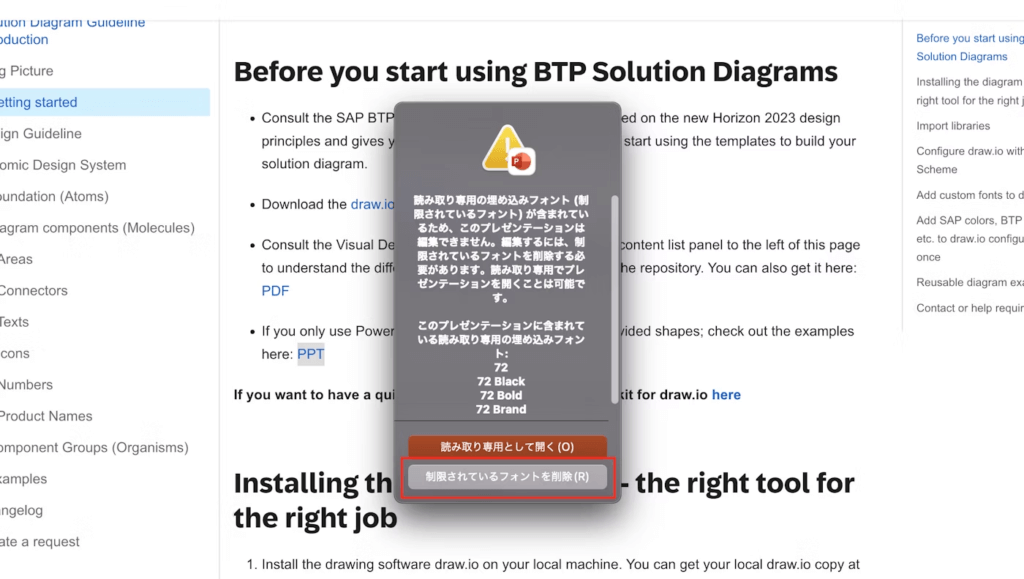
ダウンロードしたファイルを開くと、このようなメッセージが表示されます。「制限されているフォントを削除」を選択で良いと思います。「読み取り専用として開く」を選択してから「テンプレートから新規作成」を選択しても同じでした。
PowerPointのファイルを開くと、SAP BTP用の全てのアイコンが複数ページに用意されていることがわかります。新規スライドを作成して、これらのアイコンをコピー&ペーストしてダイアグラム図を作成してください。
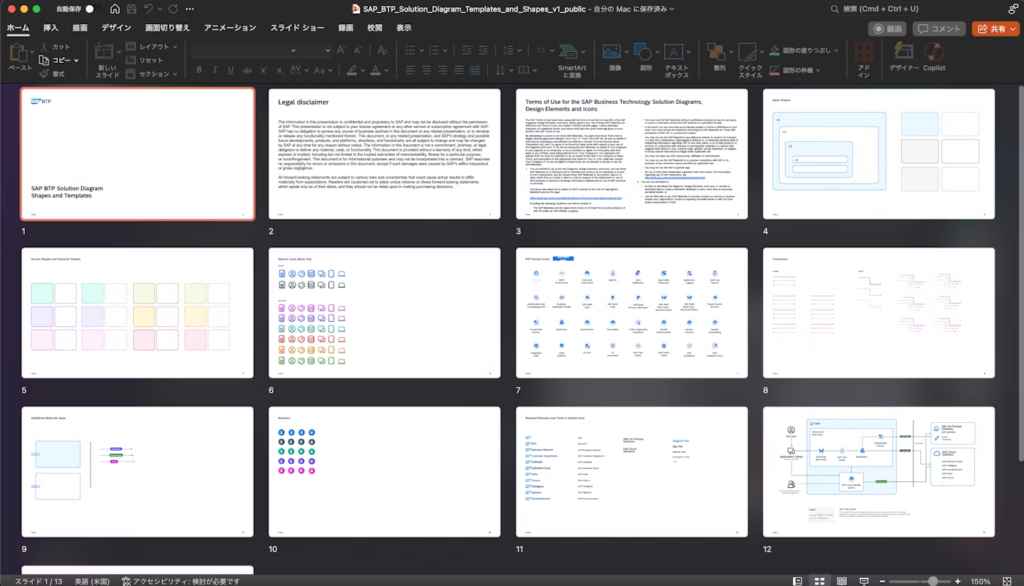
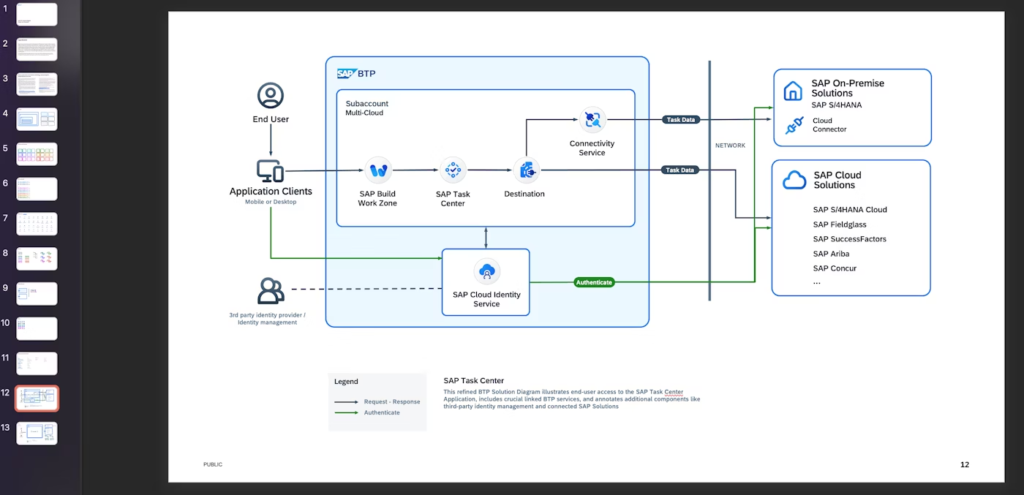
こちらはサンプルで用意されたダイアグラム図ですが、このようなカッコいい図を書けると良いですね。